Original Dataset
Below is the core dataset used for analysis, showing the Washington Capitals player statistics for the 2024–25 NHL season.
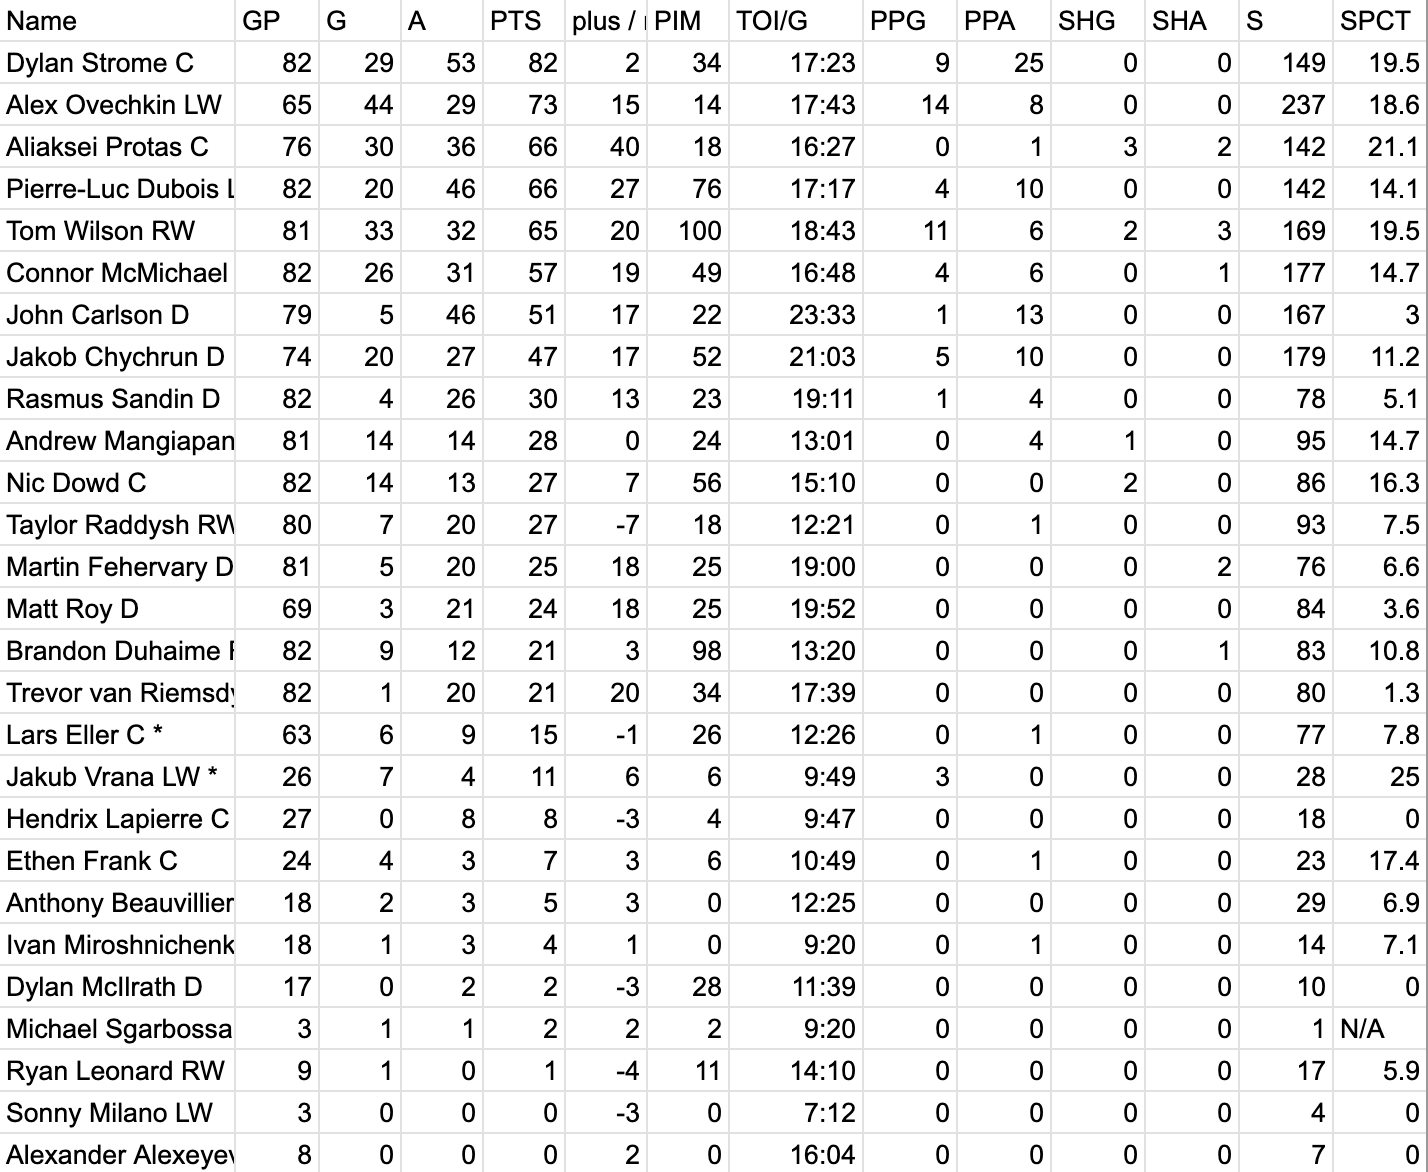
Chart 1: Goals vs Assists
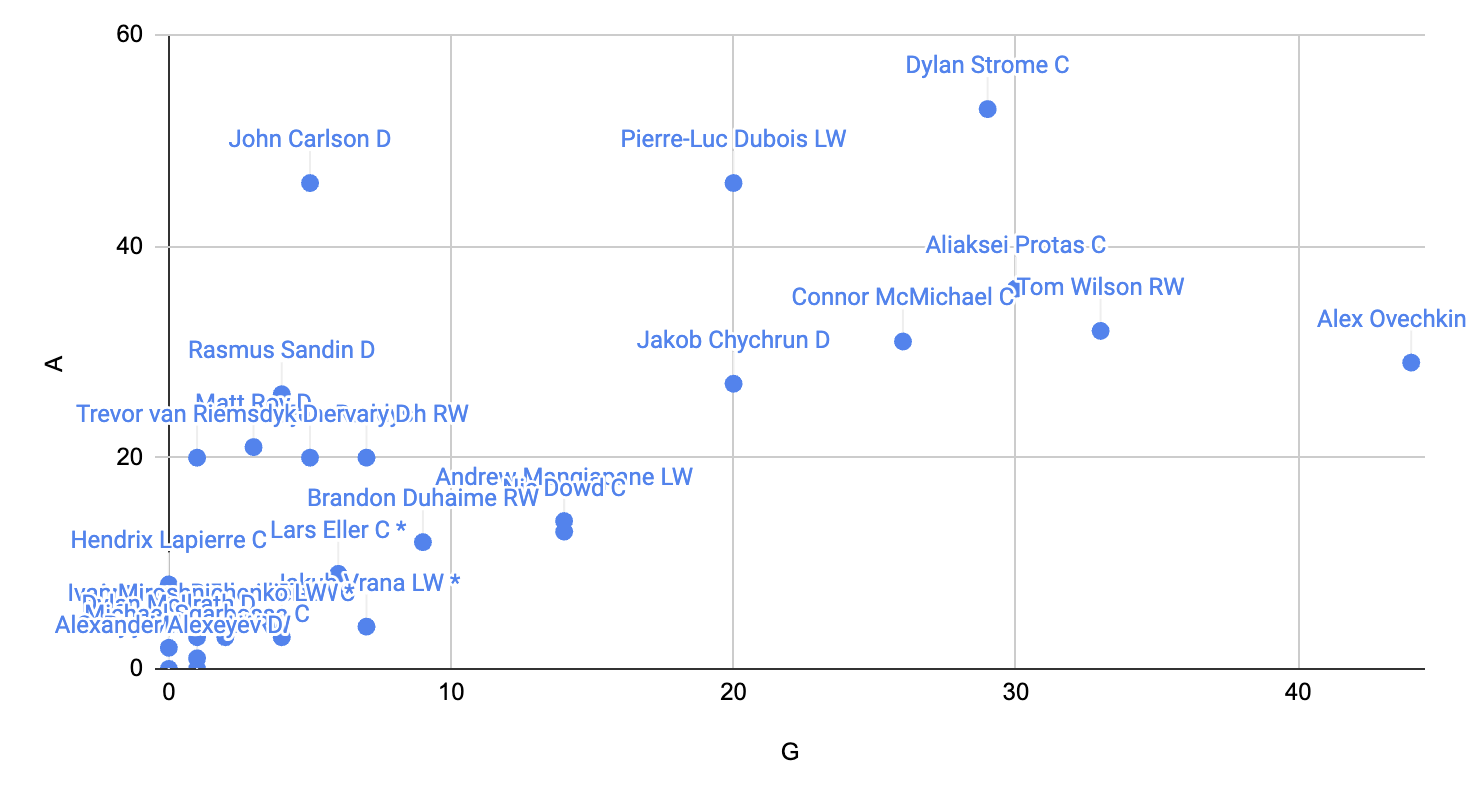
Figure 1. Scatterplot comparing player goals (G) and assists (A).
This chart shows that Alex Ovechkin is still the team’s dominant goal scorer, far ahead of his peers, while Dylan Strome stands out as the most balanced player — leading both in assists and total points. The distribution suggests a team heavily reliant on top-line forwards for offensive production.
Chart 2: Power Play Goals vs Total Points
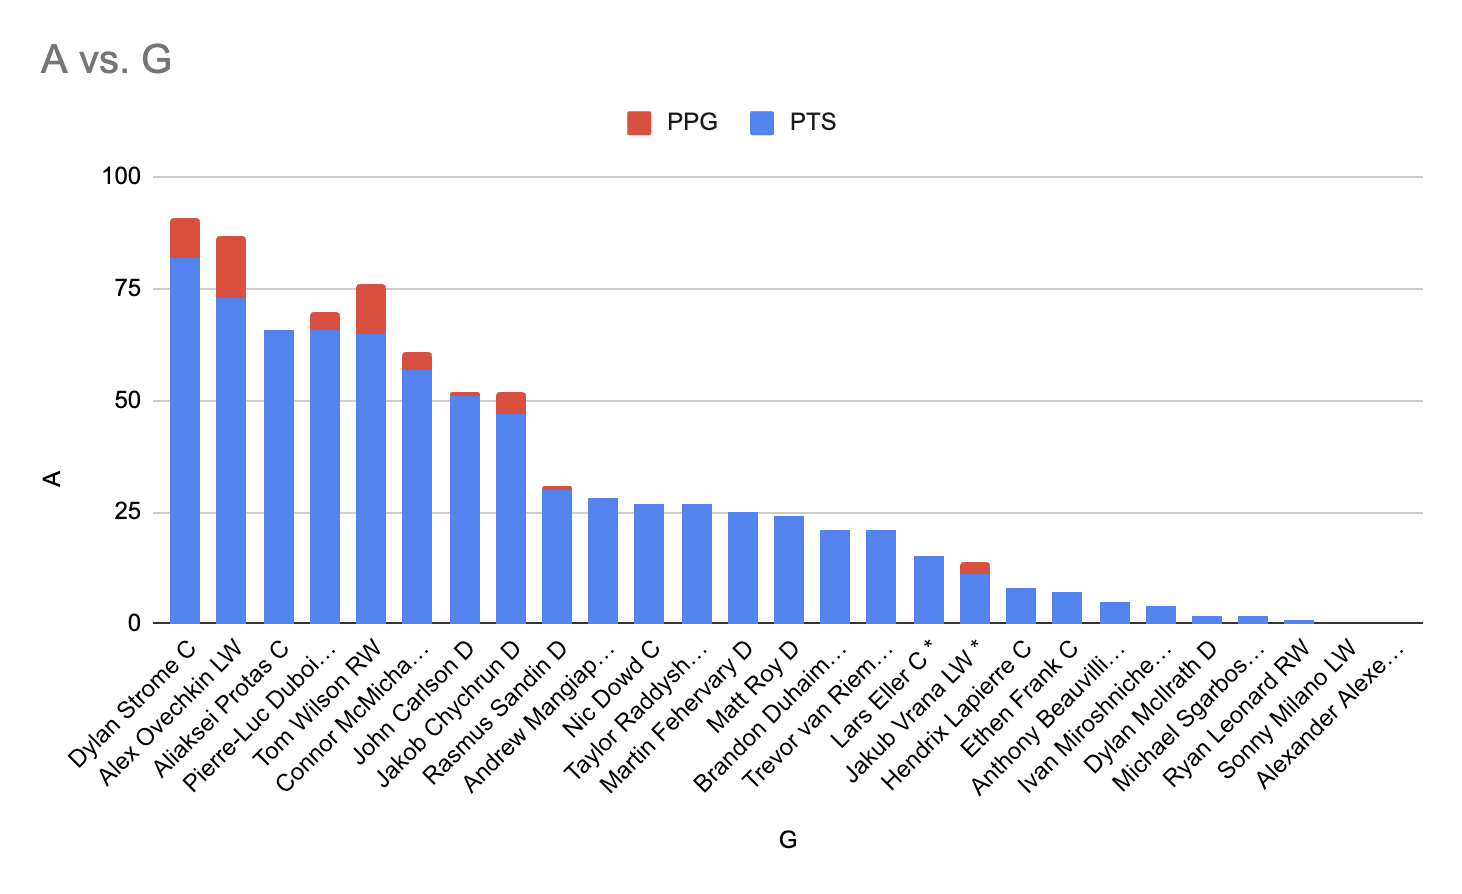
Figure 3. Bar chart showing total points (PTS) and power play goals (PPG) by player.
Players like Ovechkin and Strome contribute significantly to the power play, accounting for a large share of team special teams scoring. This indicates that the team’s power play success is tightly correlated with the performance of just a few players, which can mean limited depth in special teams scoring.
Chart 3: Shooting Percentage vs Goals
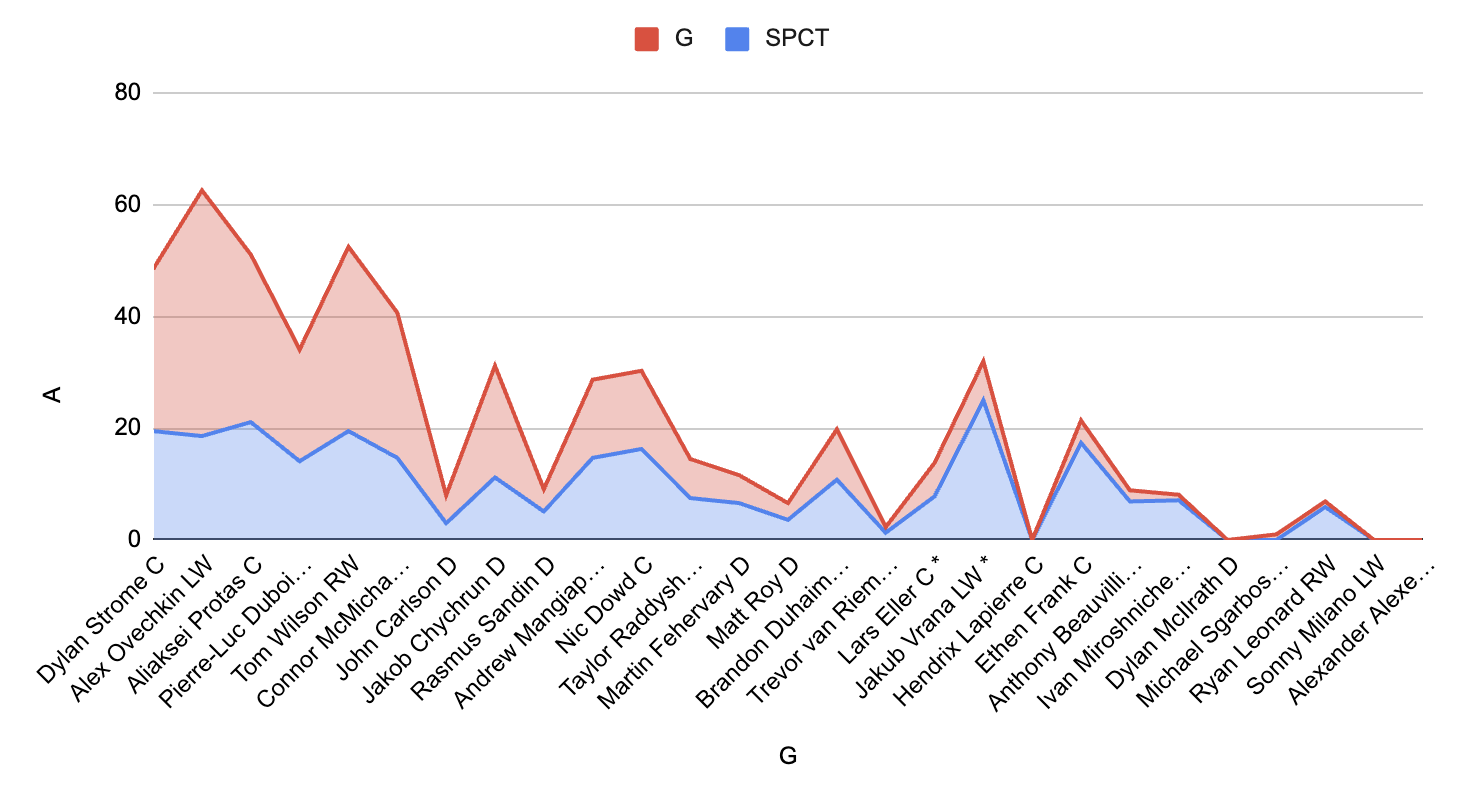
Figure 4. Player shooting percentage (SPCT) compared to total goals scored.
This visualization shows that while Ovechkin scores the most goals, his shooting efficiency (18.6%) is not the highest. Players like Protas and Strome exhibit strong efficiency relative to their shot totals, indicating they convert chances effectively. This could guide coaching strategy to create more chances for high-efficiency shooters.
Conclusion
Together, these charts reveal the Washington Capitals’ offensive structure: a top-heavy team reliant on Ovechkin and Strome for scoring and playmaking. Power play efficiency is concentrated among a few players, while secondary scorers contribute less consistently. Analyzing efficiency metrics such as shooting percentage can help identify undervalued contributors and potential adjustments for future lineups.