NHL Scoring Trends Over Time
1. Introduction
The NHL has seen dramatic shifts in scoring throughout its history — from the high-flying 1980s to the defensive “dead puck” era and beyond. Understanding how rule changes influence scoring helps predict future trends in the game.
2. Data Sources
This analysis draws from three key statistical resources:
| Source | Focus |
|---|---|
| League-wide goal averages over time | |
| Detailed player & team statistics | |
| Rule changes and historical context |
Together, they allow comparisons between what changed (rules), how it appeared in stats, and why it mattered to the league’s scoring balance.
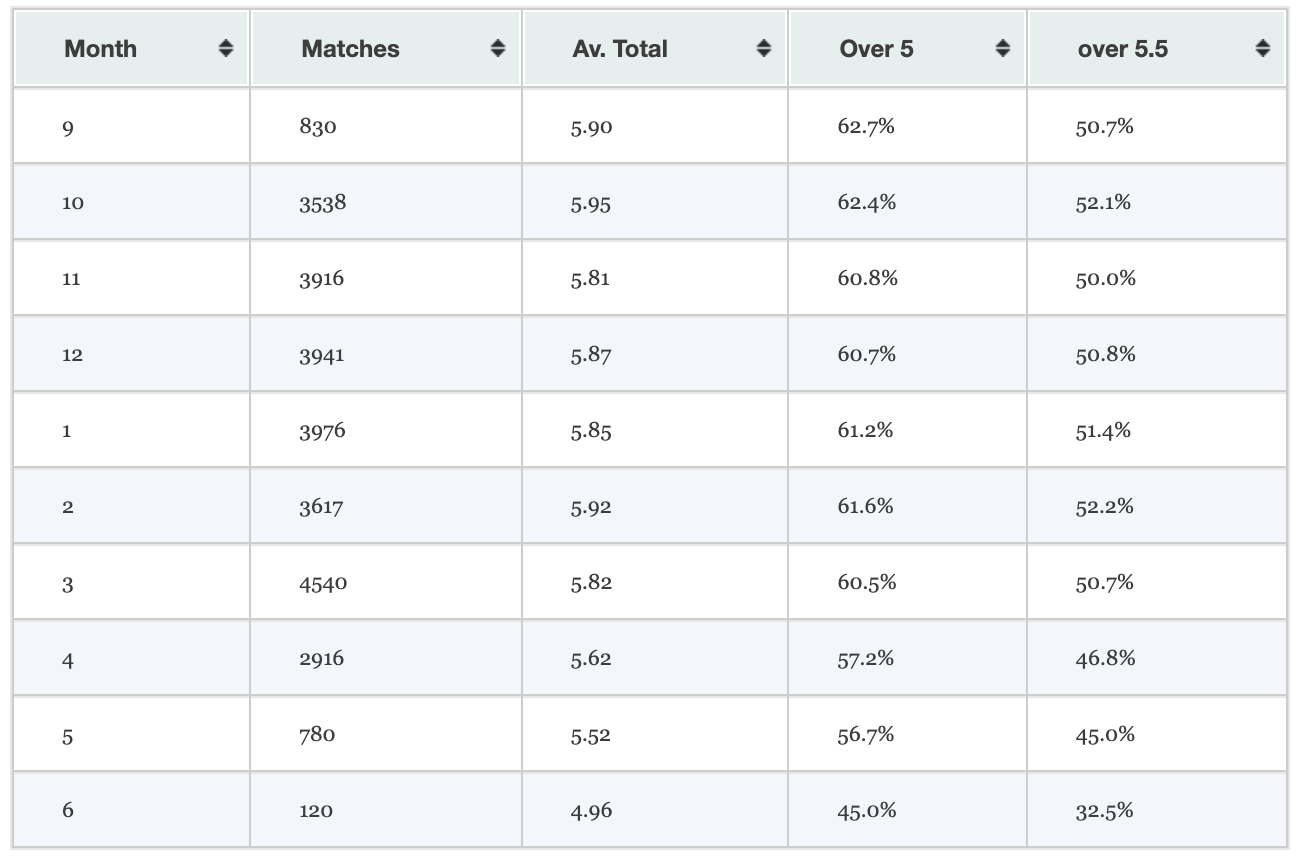
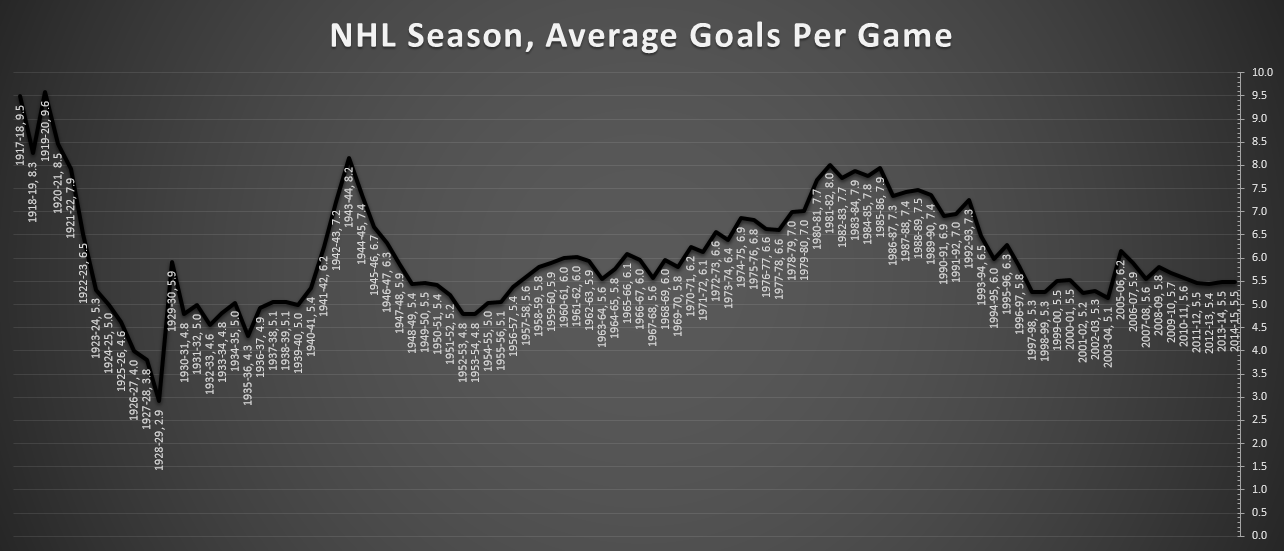
3. Scoring Patterns in the Data
Sportpunter’s data shows a steep decline in average goals per game through the mid-1990s, bottoming near 5.0. After 2005, a clear rebound appears.
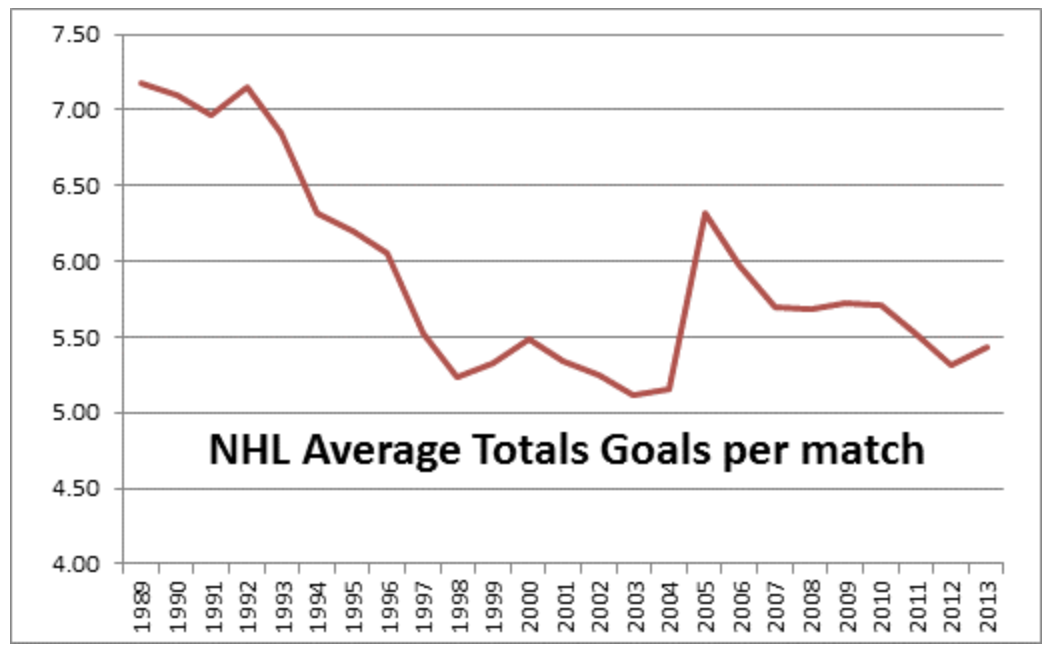
These shifts mirror changes in how teams defend — tighter neutral-zone systems and bigger goalie pads reduced offense until the NHL intervened.
4. Rule Changes and Their Effects
Hockey Analytics identifies 2005–06 as a key turning point. The NHL removed the two-line pass restriction, limited obstruction, and reduced goalie equipment size. The result: offense jumped almost instantly.
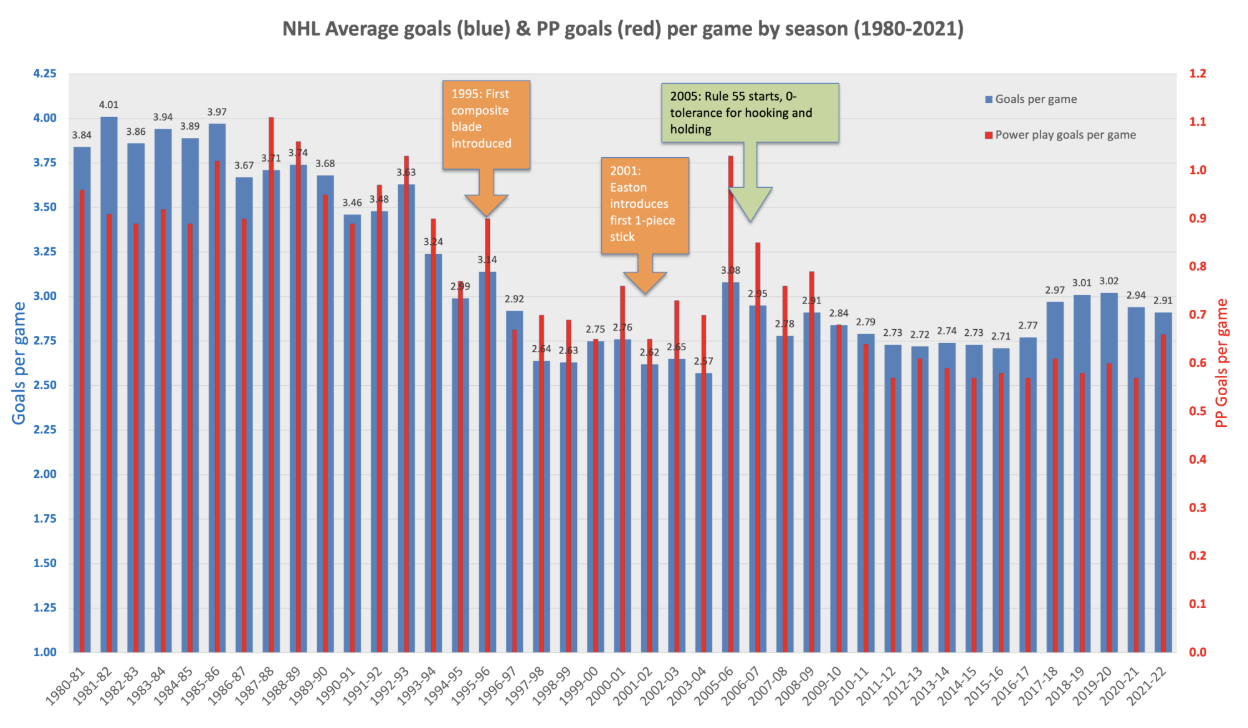
Data from Hockey Reference backs this up — scoring leaders like Crosby and Ovechkin entered the league as play sped up and power-plays grew more effective.
5. Conclusion & Future Trends
Combining these data sources reveals how tightly rule changes control offensive output. When the league seeks more excitement, small regulatory shifts can quickly reshape the scoring environment.
Looking ahead, similar data can help forecast how tweaks to goalie gear, offside reviews, or power-play rules might affect future scoring trends.